流程总览:

本流程参考华中农业大学李国亮老师的课程PPT,旨在提供一个打包好的pipeline,一行命令进行转录组数据的分析。
0. 环境配置
需要预安装的一些软件,包括:
condaconda create -n hzau_RNA-seq conda activate hzau_RNA-seq conda install python=3.10 fastqc fastp multiqc=1.26 sra-tools=3.1 samtools=1.21 -c bioconda -c conda-forge conda install hisat2=2.2.1 STAR=2.7.11b stringtie=2.2.3 subread=2.1.1 deeptools snakemake -c bioconda -c conda-forge # 大爷的 之前openssl版本有问题 conda install r-base=4.4.2 r-biocmanager r-ggplot2=3.5.1 curl=8.11.1 openssl=3.4.0 -c bioconda -c conda-forge # 我这里通过conda安装bioconductor-deseq2老有问题,只能通过BiocManager。可能你直接conda装就成功了 # conda install bioconductor-deseq2 -c bioconda -c conda-forgeinstall_DESeq2.R# 如DEseq2直接通过conda安装成功,则不需要运行 "BiocManager::install("DESeq2")" BiocManager::install("DESeq2") # 安装其它依赖 install.packages("purrr") install.packages("tibble") library(DESeq2) # Done!1. 原始数据下载
# 配置工作目录 mkdir 00.raw_sra 01.raw_fastq 02.clean_fastq 03.alignment_file 04.count_matrix 05.DEseq2 # 下载原始sra文件 cat SRR_Acc_List.txt | awk '{print $1}' |while read line; do prefetch ${line} -O 00.raw_sra & done ## 下载完需检查文件大小是否与原网页一致 # sra转fastq.gz cat SRR_Acc_List.txt | awk '{print $1}' | while read line; do fastq-dump 00.raw_sra/${line}/${line}.sra --split-3 --gzip -O 01.raw_fastq & doneSRR_Acc_List.txtSRR15859987 # mature leaves Col-0 Repeat1 SRR15859988 # mature leaves Col-0 Repeat2 SRR15859989 # mature leaves Col-0 Repeat3 SRR15859993 # mature leaves met1-3 Repeat1 SRR15859994 # mature leaves met1-3 Repeat2 SRR15859995 # mature leaves met1-3 Repeat32.
李老师这里介绍了几种常用的流程:Shell命令行操作- Fastp -> HISAT2/STAR -> featureCounts|htseq-count(基于gene Counts) -> DESeq2
- Fastp -> HISAT2/STAR -> StringTie(基于转录本) -> EdgeR
我这个()注释位置与原PPT不同,放这里个人感觉更直观。
2.1 数据质控
# raw_data 测序数据质量检测
fastqc 01.raw_fastq/*.gz -o 01.raw_fastq/ -t 12
multiqc 01.raw_fastq/ -o 01.raw_fastq/multiqc # 可以看下multiqc_report.html,原始数据有点接头

# fastq 测序数据质控
for i in 87 88 89 93 94 95
do
    fastp -i 01.raw_fastq/SRR158599${i}_1.fastq.gz -o 02.clean_fastq/SRR158599${i}_1.fastq.gz -I 01.raw_fastq/SRR158599${i}_2.fastq.gz -O 02.clean_fastq/SRR158599${i}_2.fastq.gz -h 02.clean_fastq/SRR158599${i}.fastp.html -j 02.clean_fastq/SRR158599${i}.fastp.json --thread 16
done

# clean_data 测序数据质量检测
fastqc 02.clean_fastq/*.gz -o 02.clean_fastq/ -t 12
multiqc 02.clean_fastq/ -o 02.clean_fastq/multiqc # 对比下质控前后结果

# 目前大部分情况下是不需要去除rRNA的
2.2 数据比对
首先下载基因组数据
# dna_sm 基因组softmask版本
wget https://ftp.ensemblgenomes.ebi.ac.uk/pub/plants/release-61/fasta/arabidopsis_thaliana/dna/Arabidopsis_thaliana.TAIR10.dna_sm.toplevel.fa.gz

wget https://ftp.ensemblgenomes.ebi.ac.uk/pub/plants/release-61/gtf/arabidopsis_thaliana/Arabidopsis_thaliana.TAIR10.61.gtf.gz
gzip -d *.gz

mkdir Reference
mv Arabidopsis_thaliana.TAIR10.61.gtf Reference/
mv Arabidopsis_thaliana.TAIR10.dna_sm.toplevel.fa Reference/
2.2.1 HISAT2比对
mkdir Reference/hisat2_index
# 构建HISAT2 基因组比对索引
hisat2-build -p 20 Reference/Arabidopsis_thaliana.TAIR10.dna_sm.toplevel.fa Reference/hisat2_index/Arabidopsis_thaliana.TAIR10

mkdir -p 03.alignment_file/hisat2_result
for i in 87 88 89 93 94 95
do
    hisat2 -x Reference/hisat2_index/Arabidopsis_thaliana.TAIR10 -1 02.clean_fastq/SRR158599${i}_1.fastq.gz -2 02.clean_fastq/SRR158599${i}_2.fastq.gz -S 03.alignment_file/hisat2_result/SRR158599${i}.hisat2.sam -p 20 --summary-file 03.alignment_file/hisat2_result/SRR158599${i}.hisat2.summary
done
2.2.2 STAR比对
其实使用STAR比对这一步可以不做的,我个人一般也是直接使用HISAT2进行mapping。
mkdir Reference/STAR_index
# 构建STAR 基因组比对索引
STAR --runThreadN 16 --runMode genomeGenerate --genomeDir Reference/STAR_index/ --genomeFastaFiles Reference/Arabidopsis_thaliana.TAIR10.dna_sm.toplevel.fa
# 有个 WARNING啊,课件里只用了一条染色体应该也有WARNING的
# !!!!! WARNING: --genomeSAindexNbases 14 is too large for the genome size=119667750, which may cause seg-fault at the mapping step. Re-run genome generation with recommended --genomeSAindexNbases 12
# 我们重新生成
STAR --runThreadN 16 --runMode genomeGenerate --genomeDir Reference/STAR_index/ --genomeFastaFiles Reference/Arabidopsis_thaliana.TAIR10.dna_sm.toplevel.fa --genomeSAindexNbases 12

mkdir -p 03.alignment_file/star_result
for i in 87 88 89 93 94 95
do
    STAR --runThreadN 16 --runMode alignReads --readFilesCommand zcat --outSAMunmapped None --genomeDir Reference/STAR_index/ --readFilesIn 02.clean_fastq/SRR158599${i}_1.fastq.gz 02.clean_fastq/SRR158599${i}_2.fastq.gz --outFileNamePrefix 03.alignment_file/star_result/SRR158599${i}_
done
2.2.3 sam2bam
HISAT2的输出sam是按照readsname进行排序的,可以直接用于htseq-count进行计数。但有些软件(比如:StringTie1)的输入要求必须是按position进行排序,我们需要使用samtools进行转换。而且sam文件非常大,将sam转换为bam也能很好的缓解储存压力。samtools sort的输出默认是按照position进行排序,如果这样的bam用于htseq-count计数,需指定-r pos(default: name)。这里只是提一嘴,我们这里不使用htseq-count进行计数。
for i in 87 88 89 93 94 95
do
    samtools view -@ 16 -bS 03.alignment_file/hisat2_result/SRR158599${i}.hisat2.sam > 03.alignment_file/hisat2_result/SRR158599${i}.hisat2.bam && rm 03.alignment_file/hisat2_result/SRR158599${i}.hisat2.sam

    samtools sort -@ 16 03.alignment_file/hisat2_result/SRR158599${i}.hisat2.bam -o 03.alignment_file/hisat2_result/SRR158599${i}.hisat2.sort.bam && rm 03.alignment_file/hisat2_result/SRR158599${i}.hisat2.bam

    samtools index 03.alignment_file/hisat2_result/SRR158599${i}.hisat2.sort.bam
done
2.3 计算基因表达量
2.3.1 featureCounts|htseq-count
这里使用featureCounts或htseq-count都行,我们这里参照原PPT使用featureCounts。
mkdir -p 04.count_matrix/featureCounts
for i in 87 88 89 93 94 95
do
    featureCounts -a Reference/Arabidopsis_thaliana.TAIR10.61.gtf -o 04.count_matrix/featureCounts/SRR158599${i}.featurecount.txt -p 03.alignment_file/hisat2_result/SRR158599${i}.hisat2.sort.bam   # 双端数据千万别忘了加 -p
done featureCounts的输出很简单,单个样本的情况下输出七列,第一列为基因ID,第六列为这个基因所有exon的长度(去掉了不同转录本间的冗余长度,可直接用来算FPKM),第7列为mapping到的Fragments数量(单端测序数据也称为reads数量)。

2.3.2 Stringtie
Stringtie可以用来鉴定新的转录本,挖掘可变剪切事件,也可以直接定量,参考简书教程2。
mkdir -p 04.count_matrix/stringtie
for i in 87 88 89 93 94 95
do
    stringtie -p 16 03.alignment_file/hisat2_result/SRR158599${i}.hisat2.sort.bam -G Reference/Arabidopsis_thaliana.TAIR10.61.gtf -o 04.count_matrix/stringtie/SRR158599${i}.gtf -e -A 04.count_matrix/stringtie/SRR158599${i}.gene.tab
done注意,Stringtie的输出直接为FPKM和TPM,没有count。后续的DESeq2差异表达分析的输入必须使用原始的count。其实我们用了featureCounts|htseq-count进行计数后没必要再用Stringtie,如果需要FPKM和TPM值,可以通过count进行转换。

2.4 检查样本的重复性
# 计算每个bam文件的覆盖度情况
multiBamSummary bins --bamfiles 03.alignment_file/hisat2_result/SRR15859987.hisat2.sort.bam 03.alignment_file/hisat2_result/SRR15859988.hisat2.sort.bam 03.alignment_file/hisat2_result/SRR15859989.hisat2.sort.bam 03.alignment_file/hisat2_result/SRR15859993.hisat2.sort.bam 03.alignment_file/hisat2_result/SRR15859994.hisat2.sort.bam 03.alignment_file/hisat2_result/SRR15859995.hisat2.sort.bam --minMappingQuality 30 --labels Col_rep1 Col_rep2 Col_rep3 met_rep1 met_rep2 met_rep3 -out 03.alignment_file/readCounts.npz --outRawCounts 03.alignment_file/readCounts.tab -p 20

# 基于覆盖度信息进行层次聚类
plotCorrelation -in 03.alignment_file/readCounts.npz --corMethod spearman --skipZeros --plotTitle "Spearman Correlation of Read Counts" --whatToPlot heatmap --colorMap RdYlBu --plotNumbers -o 03.alignment_file/heatmap_SpearmanCorr_readCounts.png --outFileCorMatrix 03.alignment_file/readCounts.tab
样本重复性不错: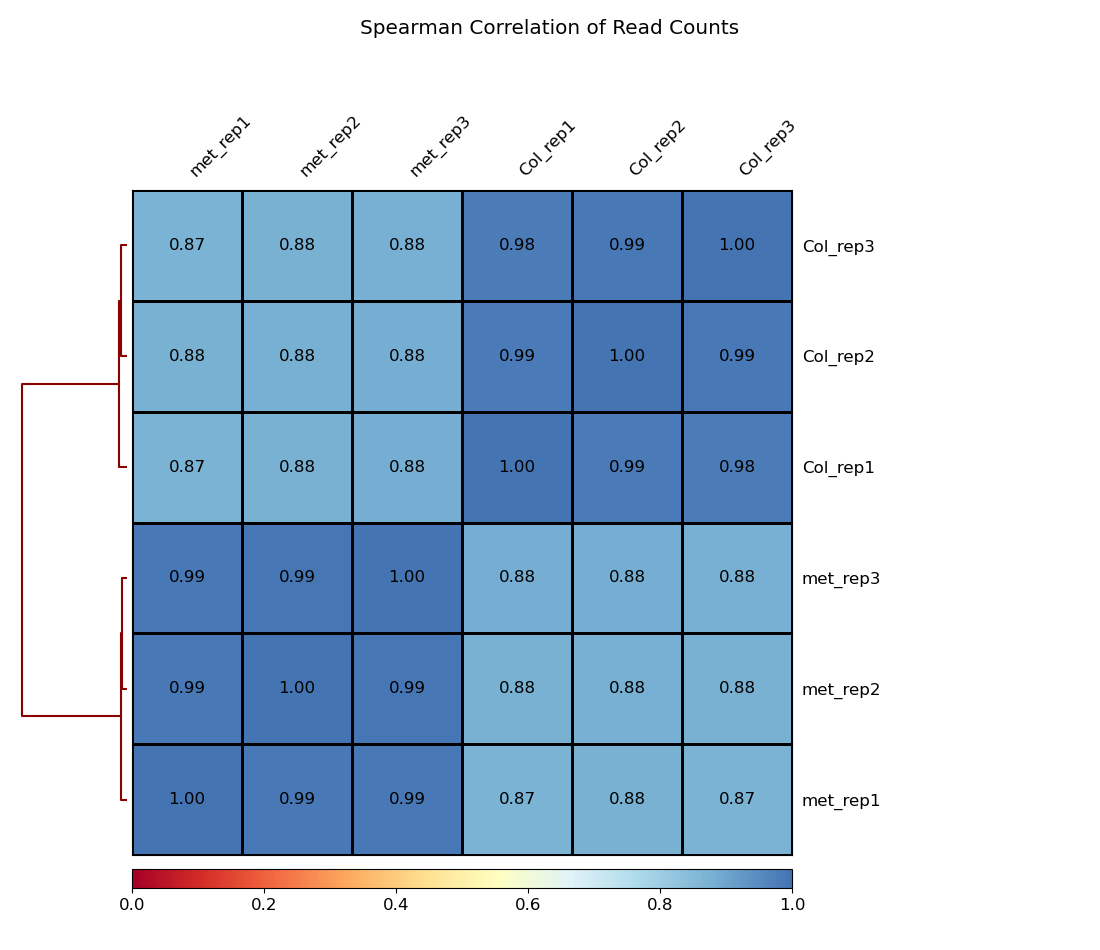
2.5 DESeq2差异表达分析
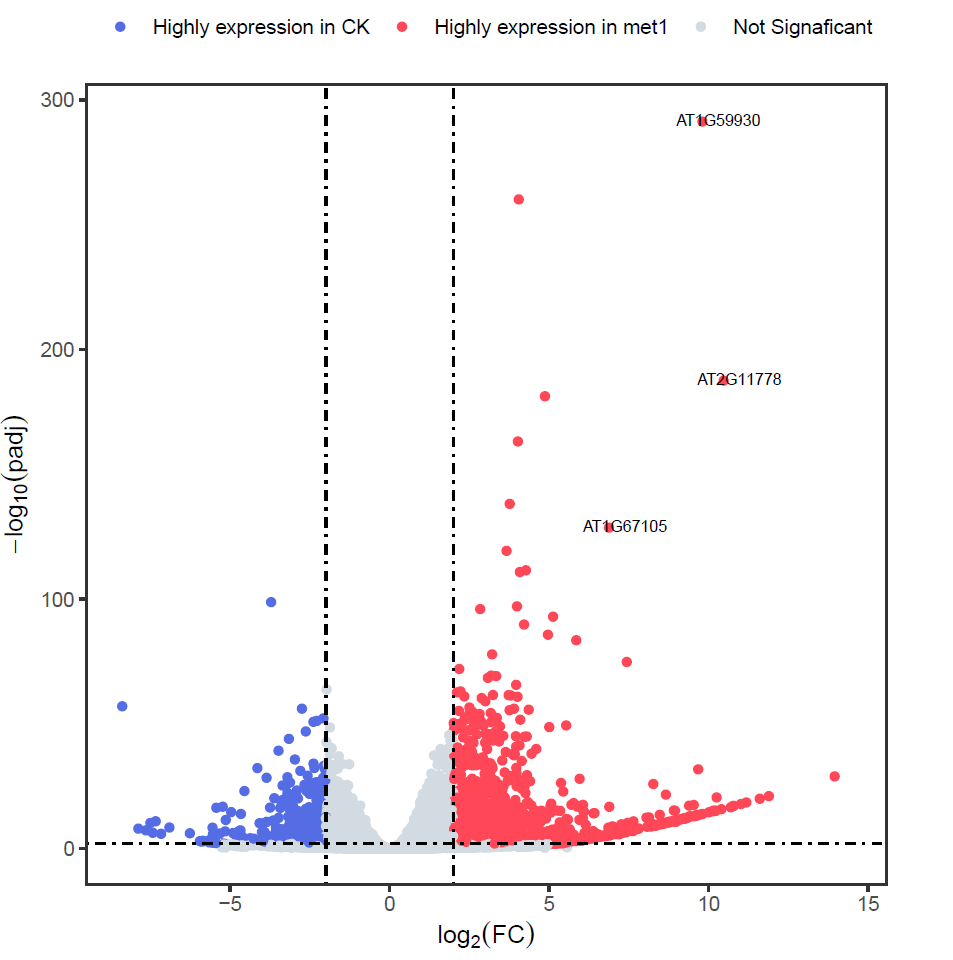
Rscript DEseq2.RDEseq2.Rlibrary(purrr) suppressMessages(library(DESeq2)) library(ggplot2) library(tibble) ################# Merge count table ################## samplelist <- c("SRR15859987", "SRR15859988", "SRR15859989", "SRR15859993", "SRR15859994", "SRR15859995") # 读取不同样本的基因表达量列表 exprlist <- lapply(samplelist, function(x){ expr <- read.table(paste0("04.count_matrix/featureCounts/", x, ".featurecount.txt"), header=T) ## 读取文件 expr<- expr[,c(1,7)] ### 提取基因id和表达量值 colnames(expr) <- c("GeneID", x) ## 重命名 expr }) # 多个基因样本的基因表达量列表合并 expr.mat <- purrr::reduce(exprlist, function(x,y){merge(x,y, by="GeneID", all.x=T)}) write.table(expr.mat, file = "./05.DEseq2/merged_count_matrix.txt", sep = "\t", quote = FALSE, row.names = FALSE ) ######################### DEG ######################### group_info <- data.frame(Sample=samplelist, Group=c(rep("Col",3), rep("met1",3))) print(group_info) expr <- column_to_rownames(expr.mat, "GeneID") # 表达矩阵 head(expr) colData <- group_info # 分组信息 colData$Group <- factor(colData$Group, levels = c("Col", "met1")) dds <- DESeqDataSetFromMatrix(countData = as.matrix(expr), colData = colData, design = ~Group) dds <- dds[rowSums(counts(dds)) > 10, ] # 过滤低表达基因 dds <- DESeq(dds) # 差异分析 print("######## Compare groups") print(resultsNames(dds)) # 查看比较组别 print(dds) # log2(met1 / Col) res <- results(dds) # 获取差异表达结果 head(res) # 查看差异表达结果 ## 保存分析结果 write.csv(res, "./05.DEseq2/deseq2.diff.csv") ####################### Volcano ####################### res.plot <- data.frame(res, stringsAsFactors = FALSE, check.names = FALSE) res.plot <- na.omit(res.plot) res.plot$gene <- rownames(res.plot) res.plot$sig <- "Not Signaficant" res.plot[res.plot$log2FoldChange > 2 & res.plot$padj < 0.01, ]$sig <- "Highly expression in met1" res.plot[res.plot$log2FoldChange < -2 & res.plot$padj < 0.01, ]$sig <- "Highly expression in Col" res.plot$label <- ifelse(res.plot$padj < 10e-100 & abs(res.plot$log2FoldChange) >= 5, rownames(res.plot), "") p <- ggplot(data=res.plot, aes(x=log2FoldChange,y= -log10(padj))) + geom_point(aes(color=sig)) + geom_text(aes(label=label), nudge_x=.5,nudge_y=.5, size=2.5) + scale_color_manual(values=c("#546de5", "#ff4757", "#d2dae2")) + labs(x=expression(log[2](FC)), y=expression(-log[10](padj))) + geom_hline(yintercept=2, linetype=4) + geom_vline(xintercept=c(-2, 2),linetype=4) + theme_bw() + theme(panel.grid = element_blank(), legend.position = "top", legend.title = element_blank(), aspect.ratio=1, legend.background = element_blank()) ## 保存 ggsave("./05.DEseq2/Volcano.plot.pdf", p, width=5.5, height=5.5)
与原PPT有点差异,不知道原PPT是比对到全基因组,还是只是Chr1。
3. snakemake pipeline
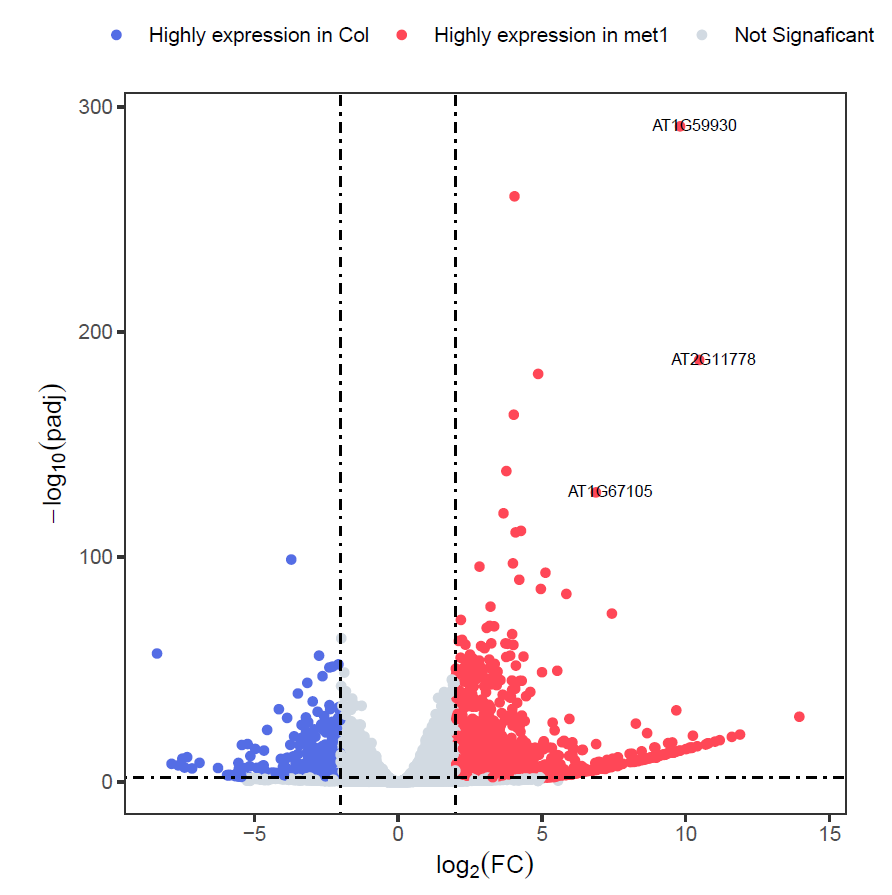
Snakefile# Snakefile for RNA-seq analysis pipeline (with pre-provided reference)
configfile: "config.yaml"

# --- 从配置文件读取参数 ---
WORK_DIR = config["work_dir"]
THREADS = config["threads"]
REF_FASTA = config["ref_fasta"]  # 基因组fasta路径
REF_GTF = config["ref_gtf"]      # 注释文件路径
REF_PREFIX = config["ref_prefix"]

# 获取所有样本列表
ALL_SAMPLES = [sample for group in config["samples"].values() for sample in group]
SAMPLES_GROUP = {sample:group for group in config["samples"] for sample in config["samples"][group]}
GROUP_OF_SAMPLES = [SAMPLES_GROUP[sample] for sample in ALL_SAMPLES]
GROUP_NAMES = unique_groups = list(dict.fromkeys(GROUP_OF_SAMPLES))
print(GROUP_NAMES)

# --- 定义目录结构 ---
dirs = [
    "00.raw_sra",
    "01.raw_fastq",
    "02.clean_fastq",
    "03.alignment_file/hisat2_result",
    "04.count_matrix/featureCounts",
    "05.DEseq2",
    "Reference/hisat2_index"
]

rule all:
    input:
        expand("05.DEseq2/{plot}", plot=["merged_count_matrix.txt", "deseq2.diff.csv", "Volcano.plot.pdf"]),
        "03.alignment_file/heatmap_SpearmanCorr_readCounts.png"

# --- 创建目录结构 ---
rule create_dirs:
    run:
        import os
        for d in dirs:
            os.makedirs(os.path.join(WORK_DIR, d), exist_ok=True)

# --- 数据下载和质控部分保持不变 ---
rule download_sra:
    output:
        "00.raw_sra/{sample}/{sample}.sra"
    params:
        outdir = "00.raw_sra"
    shell:
        "{config[tools][prefetch]} {wildcards.sample} -O {params.outdir}"

rule sra_to_fastq:
    input:
        "00.raw_sra/{sample}/{sample}.sra"
    output:
        "01.raw_fastq/{sample}_1.fastq.gz",
        "01.raw_fastq/{sample}_2.fastq.gz"
    shell:
        "{config[tools][fastq-dump]} {input} --split-3 --gzip -O 01.raw_fastq"

# --- FastQC原始数据质控 ---
rule raw_fastqc:
    input:
        raw_fq1 = "01.raw_fastq/{sample}_1.fastq.gz",
        raw_fq2 = "01.raw_fastq/{sample}_2.fastq.gz"
    output:
        "01.raw_fastq/{sample}_1_fastqc.html",
        "01.raw_fastq/{sample}_2_fastqc.html",
        "01.raw_fastq/{sample}_1_fastqc.zip",
        "01.raw_fastq/{sample}_2_fastqc.zip"

    shell:
        "{config[tools][fastqc]} {input.raw_fq1} -o 01.raw_fastq -t 1;"
        "{config[tools][fastqc]} {input.raw_fq2} -o 01.raw_fastq -t 1"

# --- MultiQC汇总报告 ---
rule raw_multiqc:
    input:
        expand("01.raw_fastq/{sample}_{pair}_fastqc.html",
               sample=ALL_SAMPLES, pair=["1", "2"])
    output:
        "01.raw_fastq/multiqc_report.html"
    shell:
        "{config[tools][multiqc]} 01.raw_fastq/ -o 01.raw_fastq"

# --- Fastp数据清洗 ---
rule fastp_clean:
    input:
        r1 = "01.raw_fastq/{sample}_1.fastq.gz",
        r2 = "01.raw_fastq/{sample}_2.fastq.gz",
        raw_multiqc = "01.raw_fastq/multiqc_report.html"
    output:
        cr1 = "02.clean_fastq/{sample}_1.fastq.gz",
        cr2 = "02.clean_fastq/{sample}_2.fastq.gz",
        html = "02.clean_fastq/{sample}.fastp.html",
        json = "02.clean_fastq/{sample}.fastp.json"
    shell:
        "{config[tools][fastp]} -i {input.r1} -I {input.r2} "
        "-o {output.cr1} -O {output.cr2} "
        "-h {output.html} -j {output.json} "
        "--thread 4"

# --- 清洗后质控 ---
rule clean_fastqc:
    input:
        clean_fq1 = "02.clean_fastq/{sample}_1.fastq.gz",
        clean_fq2 = "02.clean_fastq/{sample}_2.fastq.gz"
    output:
        "02.clean_fastq/{sample}_1_fastqc.html",
        "02.clean_fastq/{sample}_2_fastqc.html",
        "02.clean_fastq/{sample}_1_fastqc.zip",
        "02.clean_fastq/{sample}_2_fastqc.zip"

    shell:
        "{config[tools][fastqc]} {input.clean_fq1} -o 02.clean_fastq -t 1;"
        "{config[tools][fastqc]} {input.clean_fq2} -o 02.clean_fastq -t 1"

rule clean_multiqc:
    input:
        expand("02.clean_fastq/{sample}_{pair}_fastqc.html",
               sample=ALL_SAMPLES, pair=["1", "2"])
    output:
        "02.clean_fastq/multiqc_report.html"
    shell:
        "{config[tools][multiqc]} 02.clean_fastq/ -o 02.clean_fastq"

# --- 参考基因组处理 ---
print(REF_FASTA)
rule hisat2_index:
    input:
        REF_FASTA
    output:
        expand("Reference/hisat2_index/{prefix}.{n}.ht2",
               prefix=config["ref_prefix"], n=range(1,9))
    shell:
        "{config[tools][hisat2]}-build -p {THREADS} {config[ref_fasta]} Reference/hisat2_index/{config[ref_prefix]}"

# --- 比对和定量 ---
rule hisat2_align:
    input:
        clean_multiqc = "02.clean_fastq/multiqc_report.html",
        r1 = "02.clean_fastq/{sample}_1.fastq.gz",
        r2 = "02.clean_fastq/{sample}_2.fastq.gz",
        idx = expand("Reference/hisat2_index/{prefix}.{n}.ht2",
                   prefix=config["ref_prefix"], n=range(1,9))
    output:
        sam = "03.alignment_file/hisat2_result/{sample}.hisat2.sam",
        summary = "03.alignment_file/hisat2_result/{sample}.hisat2.summary"
    shell:
        "{config[tools][hisat2]} -x Reference/hisat2_index/{config[ref_prefix]} "
        "-1 {input.r1} -2 {input.r2} "
        "-S {output.sam} -p 4 "
        "--summary-file {output.summary}"

rule sam_to_bam:
    input:
        sam = "03.alignment_file/hisat2_result/{sample}.hisat2.sam"
    output:
        bam = "03.alignment_file/hisat2_result/{sample}.hisat2.sort.bam",
        bai = "03.alignment_file/hisat2_result/{sample}.hisat2.sort.bam.bai"  # 索引文件
    params:
        unsorted_bam = "03.alignment_file/hisat2_result/{sample}.hisat2.bam"  # 中间文件
    shell:
        """
        # 1. SAM转BAM
        {config[tools][samtools]} view -@ 4 -bS {input.sam} > {params.unsorted_bam}

        # 2. 排序BAM
        {config[tools][samtools]} sort -@ 4 {params.unsorted_bam} -o {output.bam}

        # 3. 删除中间文件
        rm -v {params.unsorted_bam} {input.sam}

        # 4. 创建索引
        {config[tools][samtools]} index {output.bam}
        """

rule feature_counts:
    input:
        bam = "03.alignment_file/hisat2_result/{sample}.hisat2.sort.bam",
        gtf = REF_GTF
    output:
        counts = "04.count_matrix/featureCounts/{sample}.featurecount.txt"
    shell:
        "{config[tools][featurecounts]} -a {input.gtf} -o {output.counts} "
        "-p {input.bam}"

# --- 样本相关性分析 ---
rule sample_correlation:
    input:
        bams = expand("03.alignment_file/hisat2_result/{sample}.hisat2.sort.bam", sample=ALL_SAMPLES)
    output:
        "03.alignment_file/heatmap_SpearmanCorr_readCounts.png",
        "03.alignment_file/readCounts.npz",
        "03.alignment_file/readCounts.tab"
    params:
        labels = lambda wildcards: " ".join(
            [f"{group}_rep{i+1}"
             for group in config["samples"]
             for i, sample in enumerate(config["samples"][group])]
    )
    shell:
        "{config[tools][multiBamSummary]} bins --bamfiles {input.bams} "
        "--minMappingQuality 30 --labels {params.labels} "
        "-out {output[1]} --outRawCounts {output[2]} "
        "-p {THREADS} \n"
        "{config[tools][plotCorrelation]} -in {output[1]} --corMethod spearman "
        "--skipZeros --plotTitle 'Spearman Correlation of Read Counts' "
        "--whatToPlot heatmap --colorMap RdYlBu --plotNumbers "
        "-o {output[0]}"

# --- DESeq2差异分析 ---
rule merged_deseq2_analysis:
    input:
        counts = expand("04.count_matrix/featureCounts/{sample}.featurecount.txt", sample=ALL_SAMPLES),
        gtf = REF_GTF
    output:
        merged_count_txt = "05.DEseq2/merged_count_matrix.txt",
        diff_csv = "05.DEseq2/deseq2.diff.csv",
        volcano = "05.DEseq2/Volcano.plot.pdf"
    run:
        # 准备分组信息
        group_data = []
        for group_name, samples in config["samples"].items():
            group_data.extend([f"'{s}':'{group_name}'" for s in samples])

        # 将列表转换为字符串
        sample_str = ','.join([f"'{s}'" for s in ALL_SAMPLES])
        group_str = ','.join([f"'{g}'" for g in GROUP_OF_SAMPLES])
        group_class_str =  ','.join([f"'{c}'" for c in GROUP_NAMES])

        # 生成R脚本
        script = f"""
library(purrr)
suppressMessages(library(DESeq2))
library(ggplot2)
library(tibble)

samplelist <- c({sample_str})
grouplist <- c({group_str})

exprlist <- lapply(samplelist, function(x){{
     expr <- read.table(paste0('04.count_matrix/featureCounts/', x, '.featurecount.txt'), header=T)
     expr<- expr[,c(1,7)]
     colnames(expr) <- c('GeneID', x)
     expr
}})

expr.mat <- purrr::reduce(exprlist, function(x,y){{merge(x,y, by="GeneID", all.x=T)}})
write.table(expr.mat,
    file = "{output.merged_count_txt}",
    sep = "\t",
    quote = FALSE,
    row.names = FALSE)

group_info <- data.frame(Sample=samplelist, Group=grouplist)
print(group_info)
expr <- column_to_rownames(expr.mat, "GeneID")
head(expr)
colData <- group_info
colData$Group <- factor(colData$Group, levels = c({group_class_str}))
dds <- DESeqDataSetFromMatrix(countData = as.matrix(expr), colData = colData, design = ~Group)
dds <- dds[rowSums(counts(dds)) > 10, ]
dds <- DESeq(dds)
print(resultsNames(dds))
print(dds)
res <- results(dds)
head(res)
write.csv(res, "{output.diff_csv}")

res.plot <- data.frame(res, stringsAsFactors = FALSE, check.names = FALSE)
res.plot <- na.omit(res.plot)
res.plot$gene <- rownames(res.plot)
res.plot$sig <- "Not Signaficant"
res.plot[res.plot$log2FoldChange > 2 & res.plot$padj < 0.01, ]$sig <- "Highly expression in met1"
res.plot[res.plot$log2FoldChange < -2 & res.plot$padj < 0.01, ]$sig <- "Highly expression in CK"
res.plot$label <- ifelse(res.plot$padj < 10e-100 & abs(res.plot$log2FoldChange) >= 5,
                        rownames(res.plot), "")
p <- ggplot(data=res.plot, aes(x=log2FoldChange,y= -log10(padj))) +
  geom_point(aes(color=sig)) +
  geom_text(aes(label=label),  nudge_x=.5,nudge_y=.5, size=2.5) +
  scale_color_manual(values=c("#546de5", "#ff4757", "#d2dae2")) +
  labs(x=expression(log[2](FC)), y=expression(-log[10](padj))) +
  geom_hline(yintercept=2, linetype=4) +
  geom_vline(xintercept=c(-2, 2),linetype=4) +
  theme_bw() + theme(panel.grid = element_blank(),
  legend.position = "top", legend.title = element_blank(), aspect.ratio=1,
        legend.background = element_blank())

ggsave("{output.volcano}", p, width=8, height=6)
"""
        with open("merged_analysis.R", "w") as f:
            f.write(script)
        shell("Rscript merged_analysis.R")
config.yaml# config.yaml
samples:
  CK:
    - SRR15859987
    - SRR15859988
    - SRR15859989
  met1:
    - SRR15859993
    - SRR15859994
    - SRR15859995

# 参考文件配置
ref_fasta: "../Reference/Arabidopsis_thaliana.TAIR10.dna_sm.toplevel.fa"
ref_gtf: "../Reference/Arabidopsis_thaliana.TAIR10.61.gtf"
ref_prefix: "Arabidopsis_thaliana.TAIR10"

work_dir: "."
threads: 16

# 工具路径配置
tools:
  fastqc: "fastqc"
  multiqc: "multiqc"
  fastp: "fastp"
  hisat2: "hisat2"
  samtools: "samtools"
  featurecounts: "featureCounts"
  prefetch: "prefetch"
  fastq-dump: "fastq-dump"
  multiBamSummary: "multiBamSummary"
  plotCorrelation: "plotCorrelation"
snakemake -j 20